
QPlant · Bridging the gap in capital cost estimation
Model the project. Get the estimate.
QPlant turns your plant into a Total Installed Cost estimate, all in one workspace. Modern estimating that is simple to learn, quick to update, and meets you where you already are.
Works with what you have
Bring your data in. Take your results out.
QPlant works alongside the tools your team already uses.
Import Options
- Process Simulators
- CAD Software Outputs
- Plot Plans
- P&IDs
- Equipment Lists
- Excel
- CSV
- Bulk Lists
- Pipe MTO
- DBM Project Scope
QPlant
Your workspace. Your estimate.
Outputs
- Fully Detailed Cost Estimate
- Quantity-based Estimates
- PDF Executive Report
- Code of Accounts
- Equipment Details
- Scenario Comparison Workbook
A new way of thinking
01The table
Most estimates live in a table.
Tables weren’t designed to keep pace with a changing project. A single change can break formulas, disrupt links, and force hours of manual correction. Versions accumulate, clarity is lost, and the estimate is rebuilt every time the scope moves.
02QPlant
The plant is the estimate.
Every pipe, structure, and piece of equipment is priced as a line item, automatically, whether you build it in QPlant or bring it in from your existing tools. Nothing sits in a separate model, and nothing needs redoing when the scope moves. The estimate stays current, because it lives where the layout does.
03The estimate
The estimate updates as you build.
A live Total Installed Cost and risk range that starts with your first rough layout and sharpens with every detail you add. Adjust the layout, and the estimate follows, always current and ready to defend.
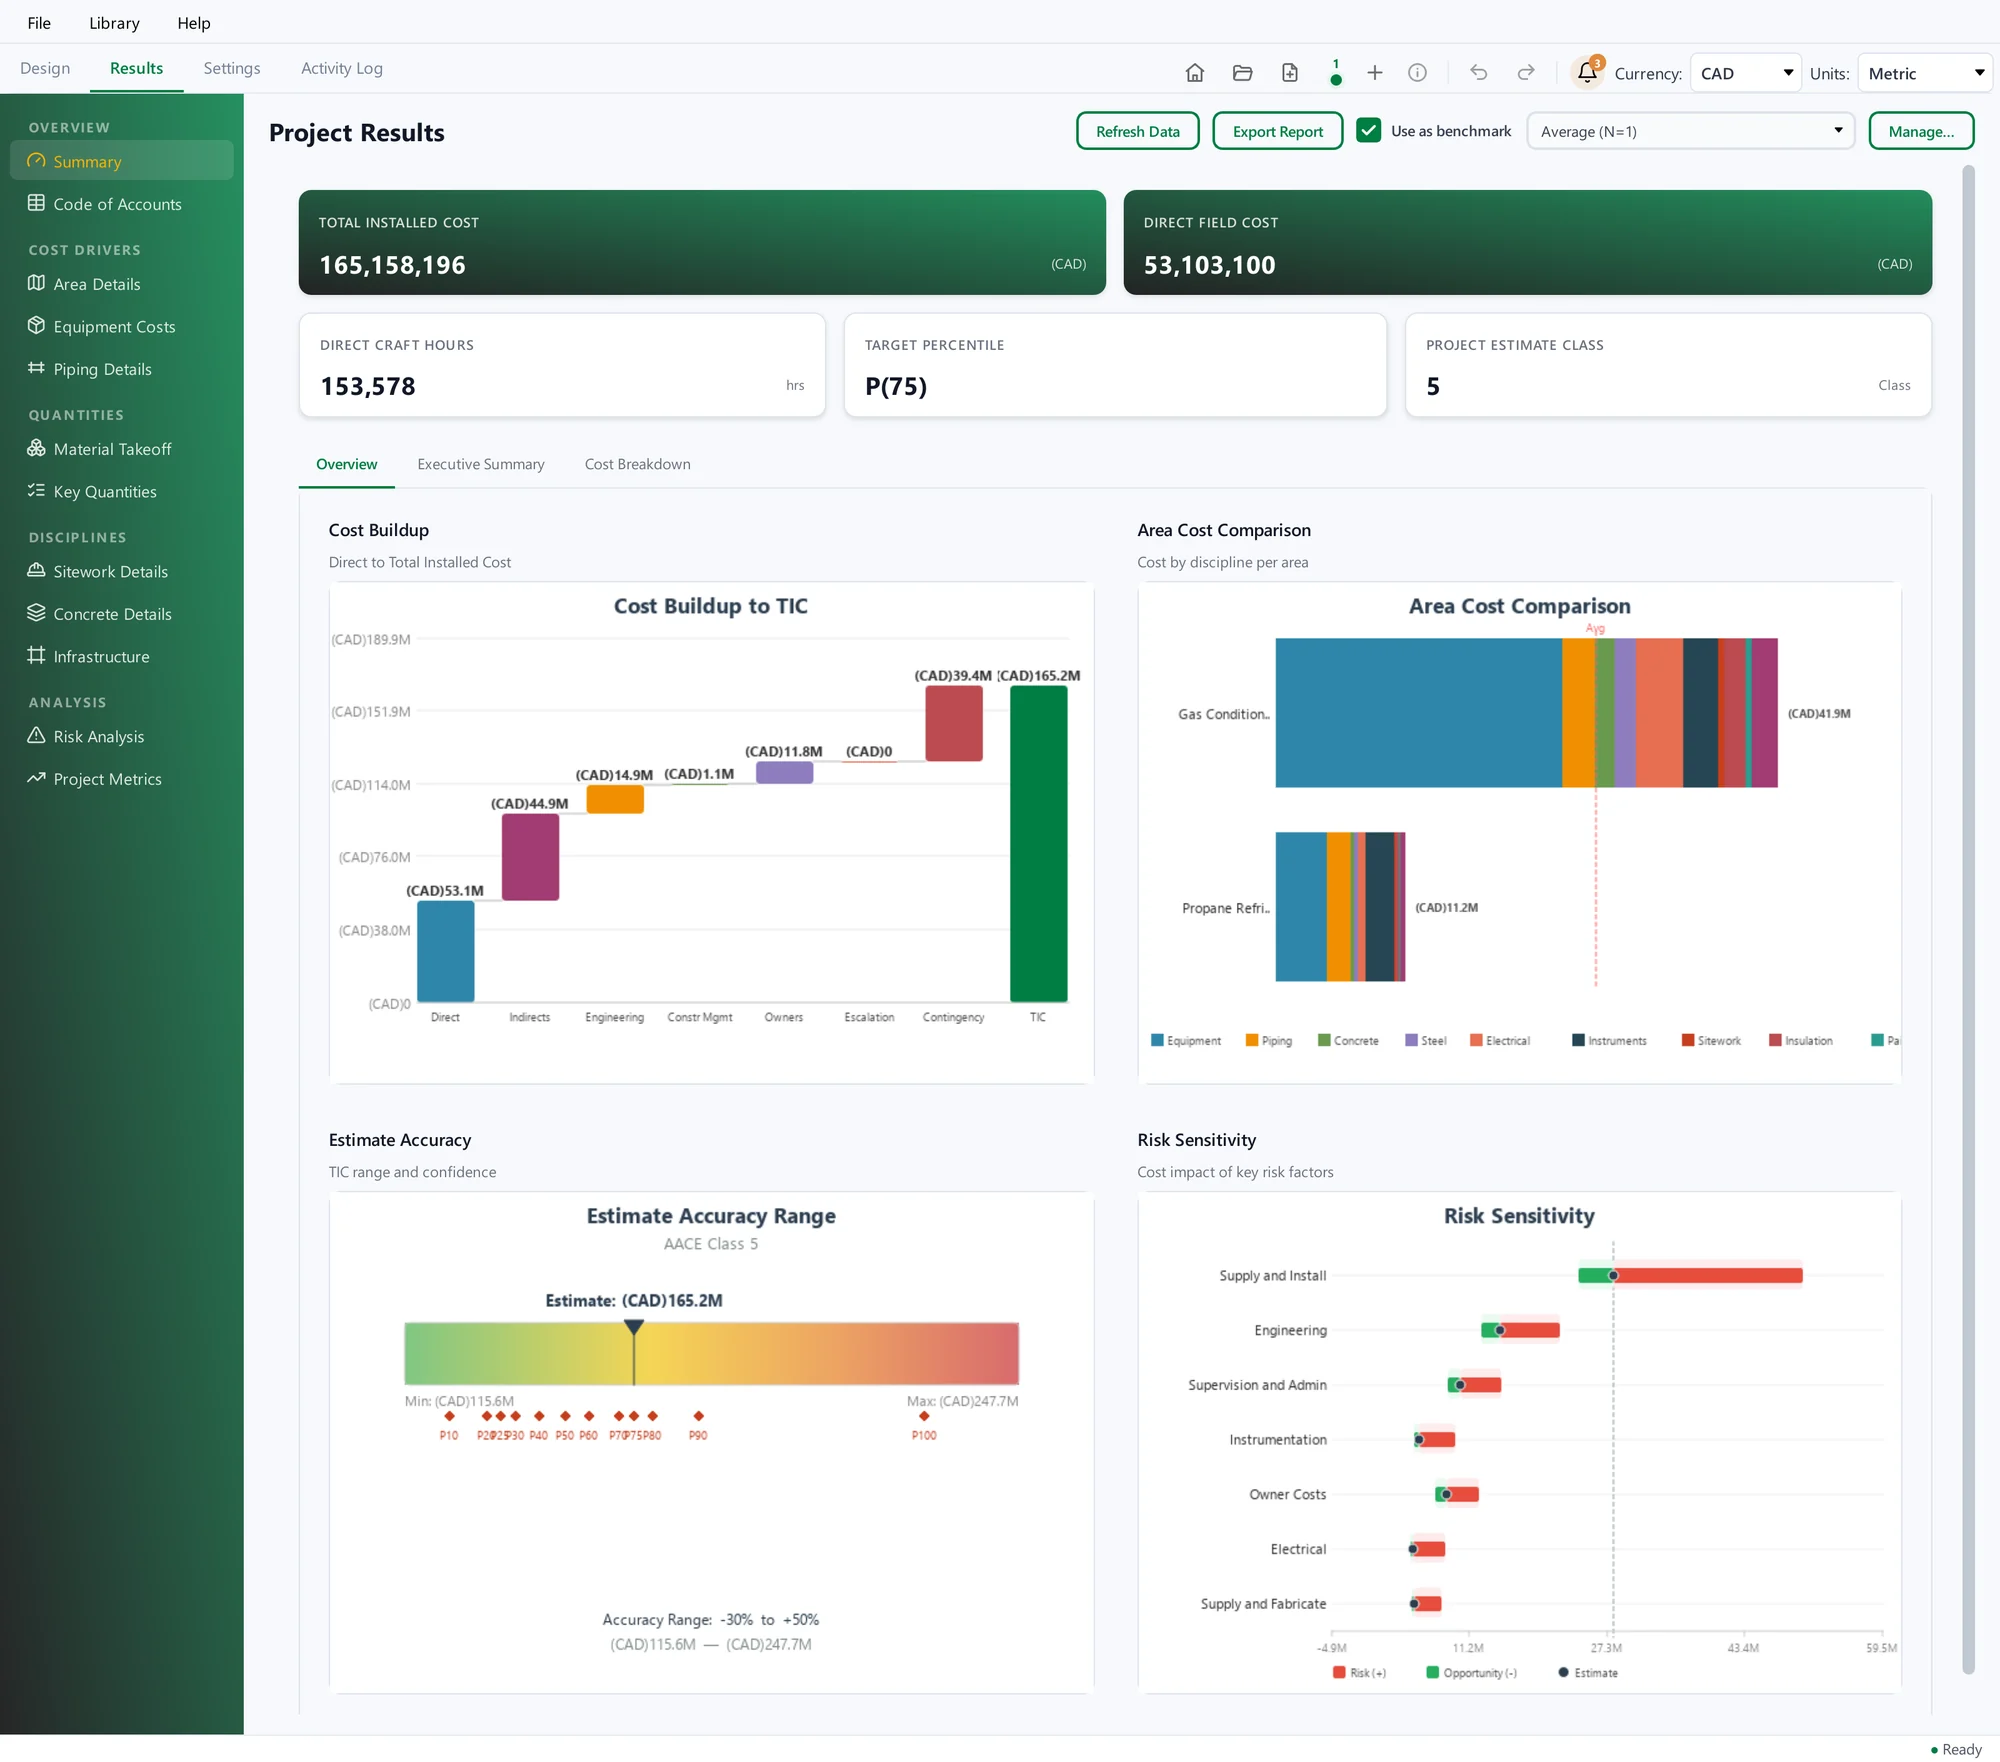
What QPlant does
Model it. Price it. Defend it.
Go from first layout to a finished estimate in one connected workspace. Model the project, price every item, and step into any room with numbers you can defend.
Model it
Whether your plant exists on a canvas, in a simulator, in a P&ID, in an equipment list, or as a draft from the built-in AI assistant, QPlant turns it into a live model that responds to every change.
Minimal input from you, far more handled by QPlant, and no manual upkeep.
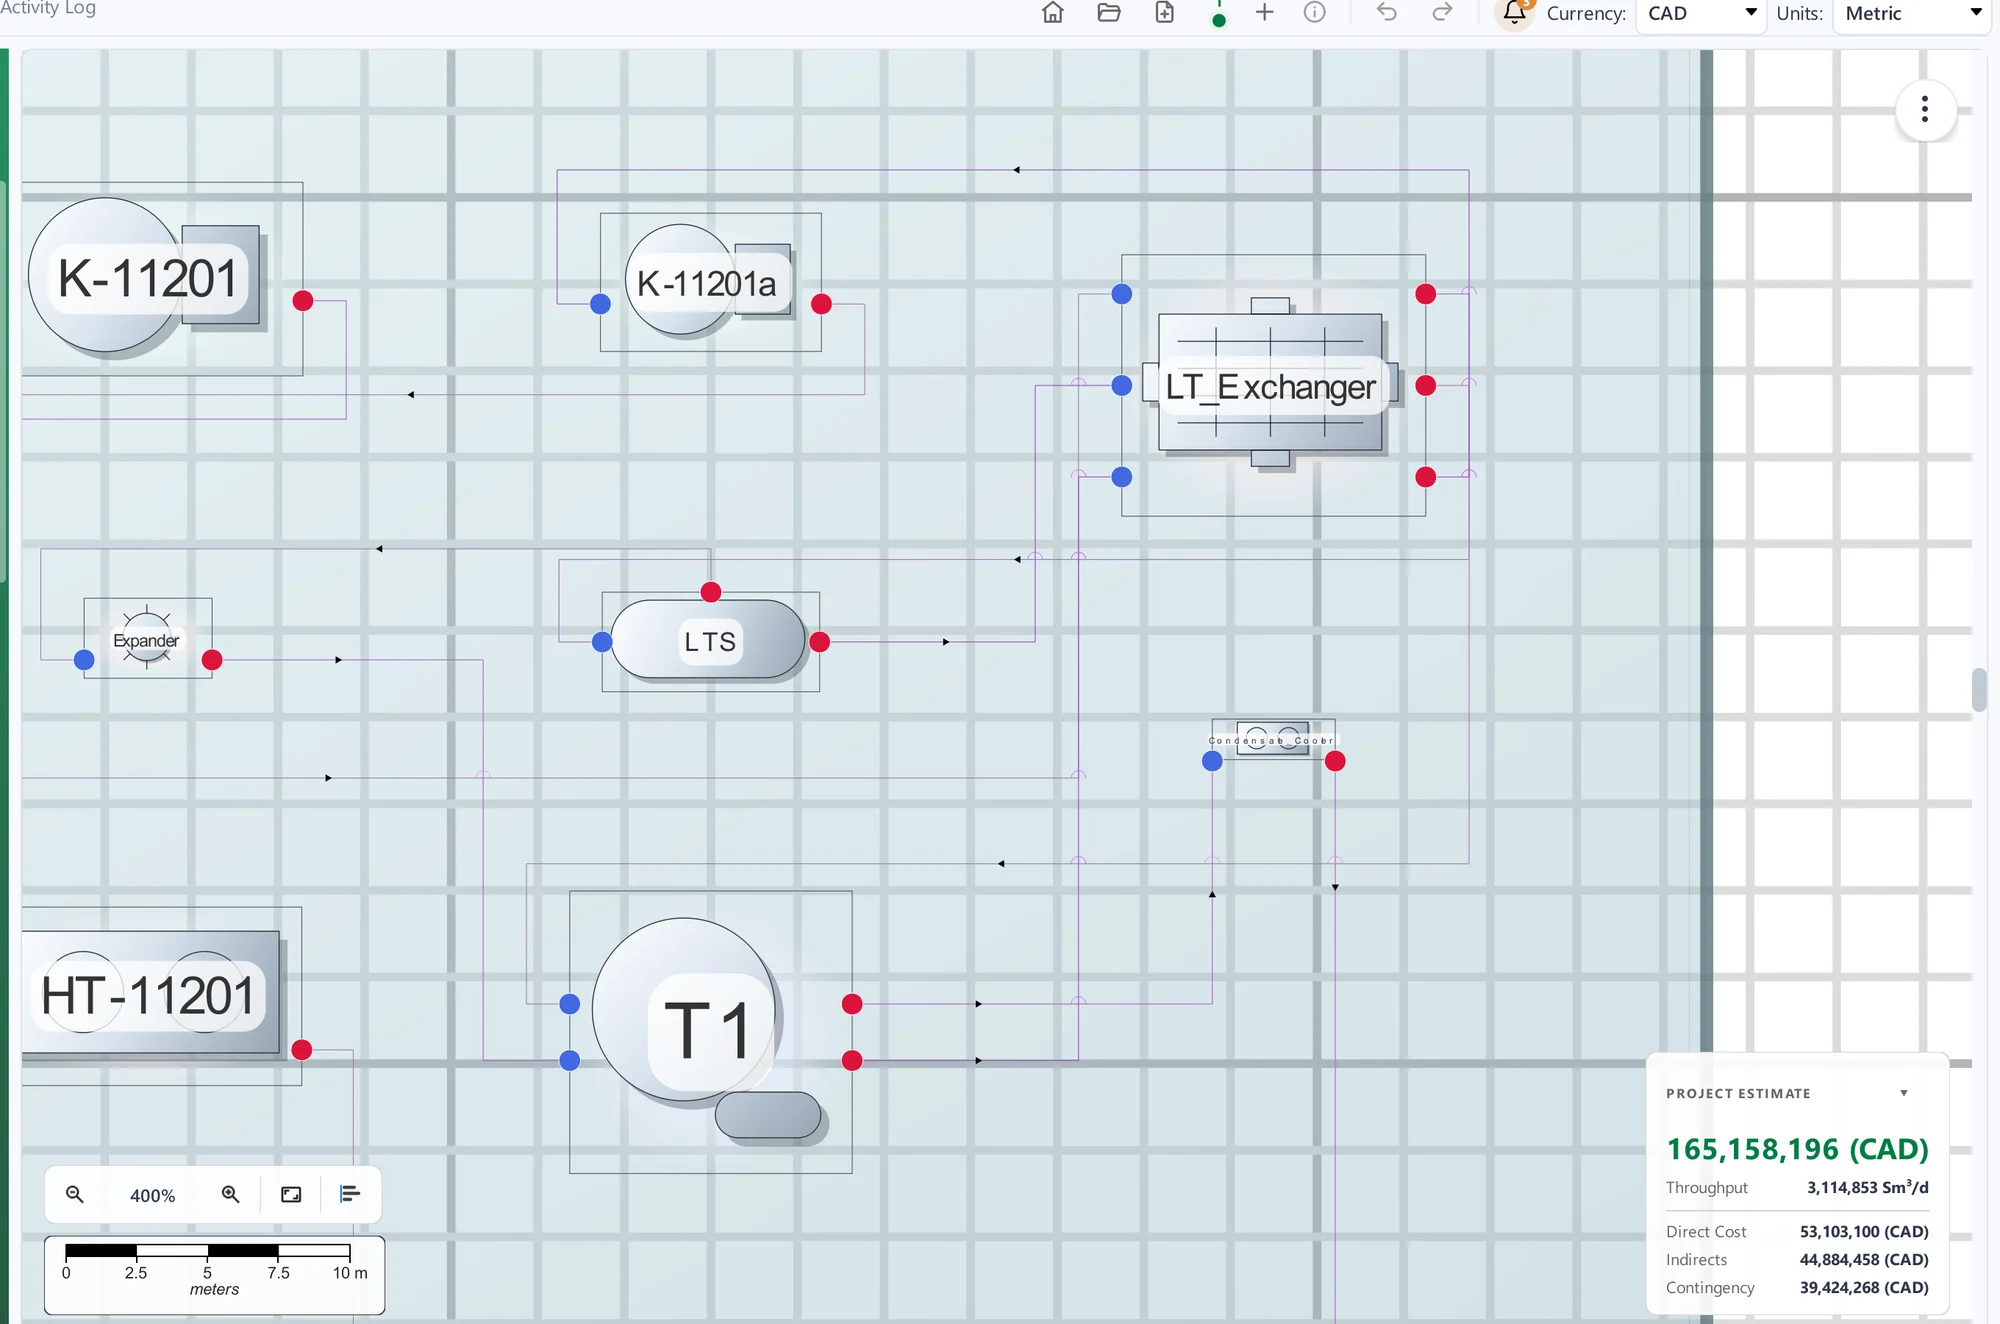
Price it
Equipment, pipework, structures, and indirects are costed directly from the layout as you work, so every item is priced as part of the model.
Built-in defaults cover anything not yet specified, so a complete estimate is available from the outset. As the project develops, swap in your own rates, allowances, and supplier pricing.
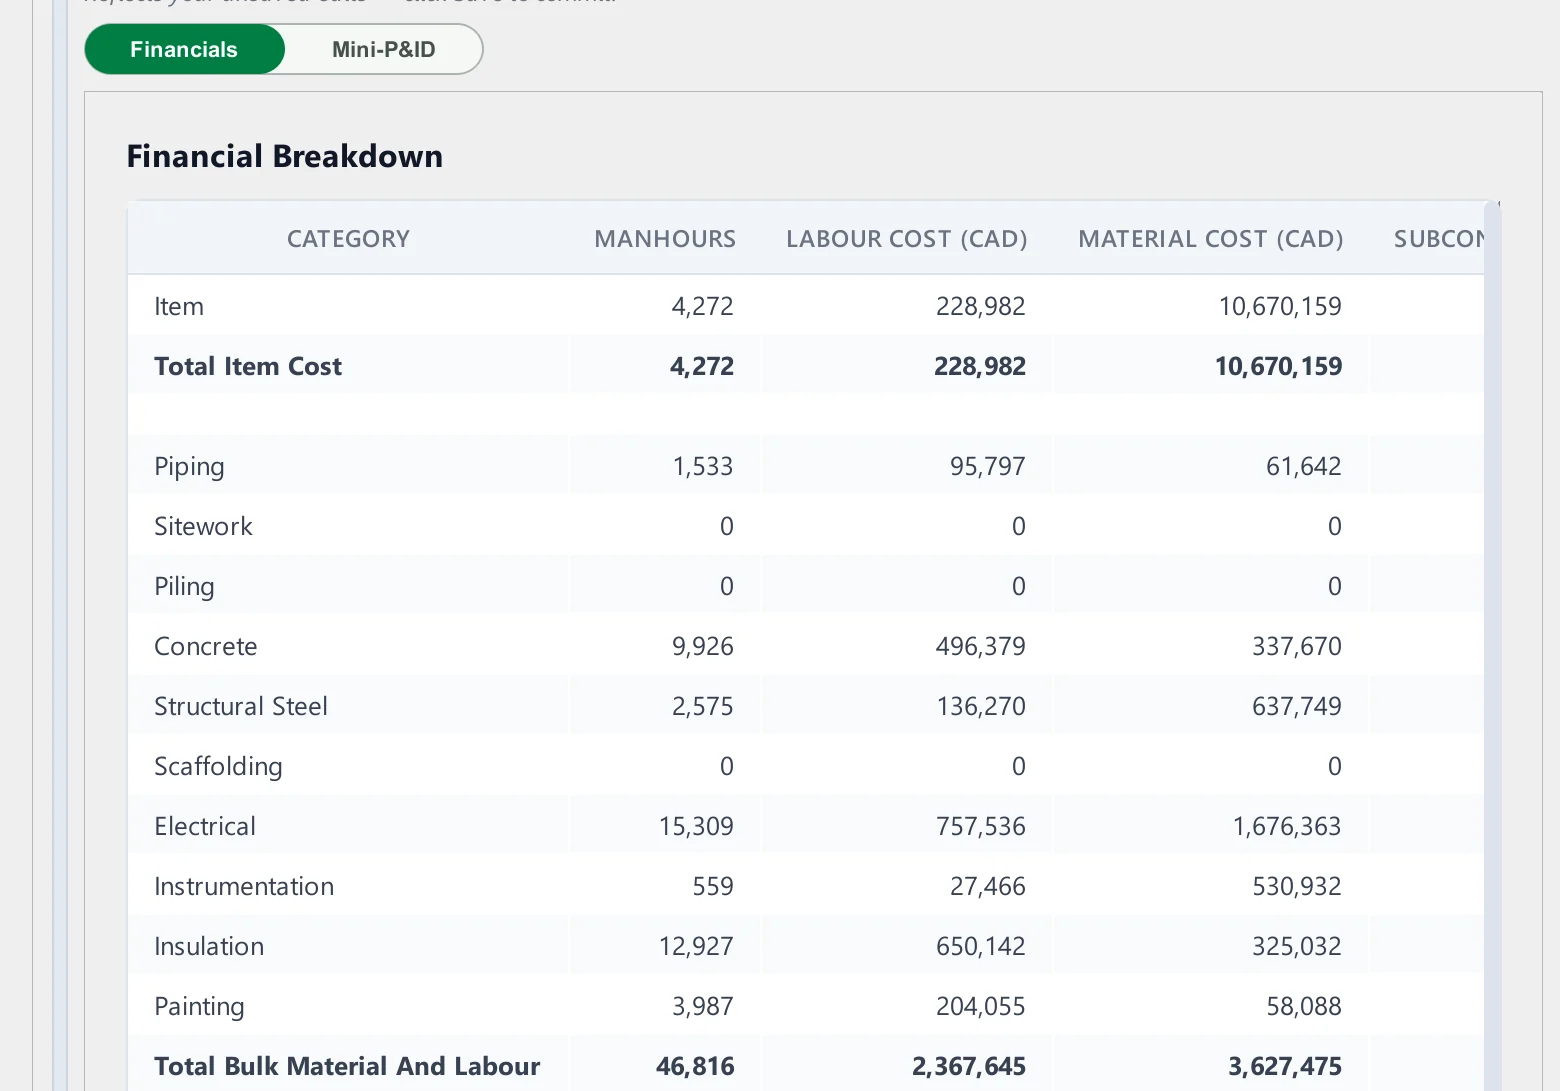
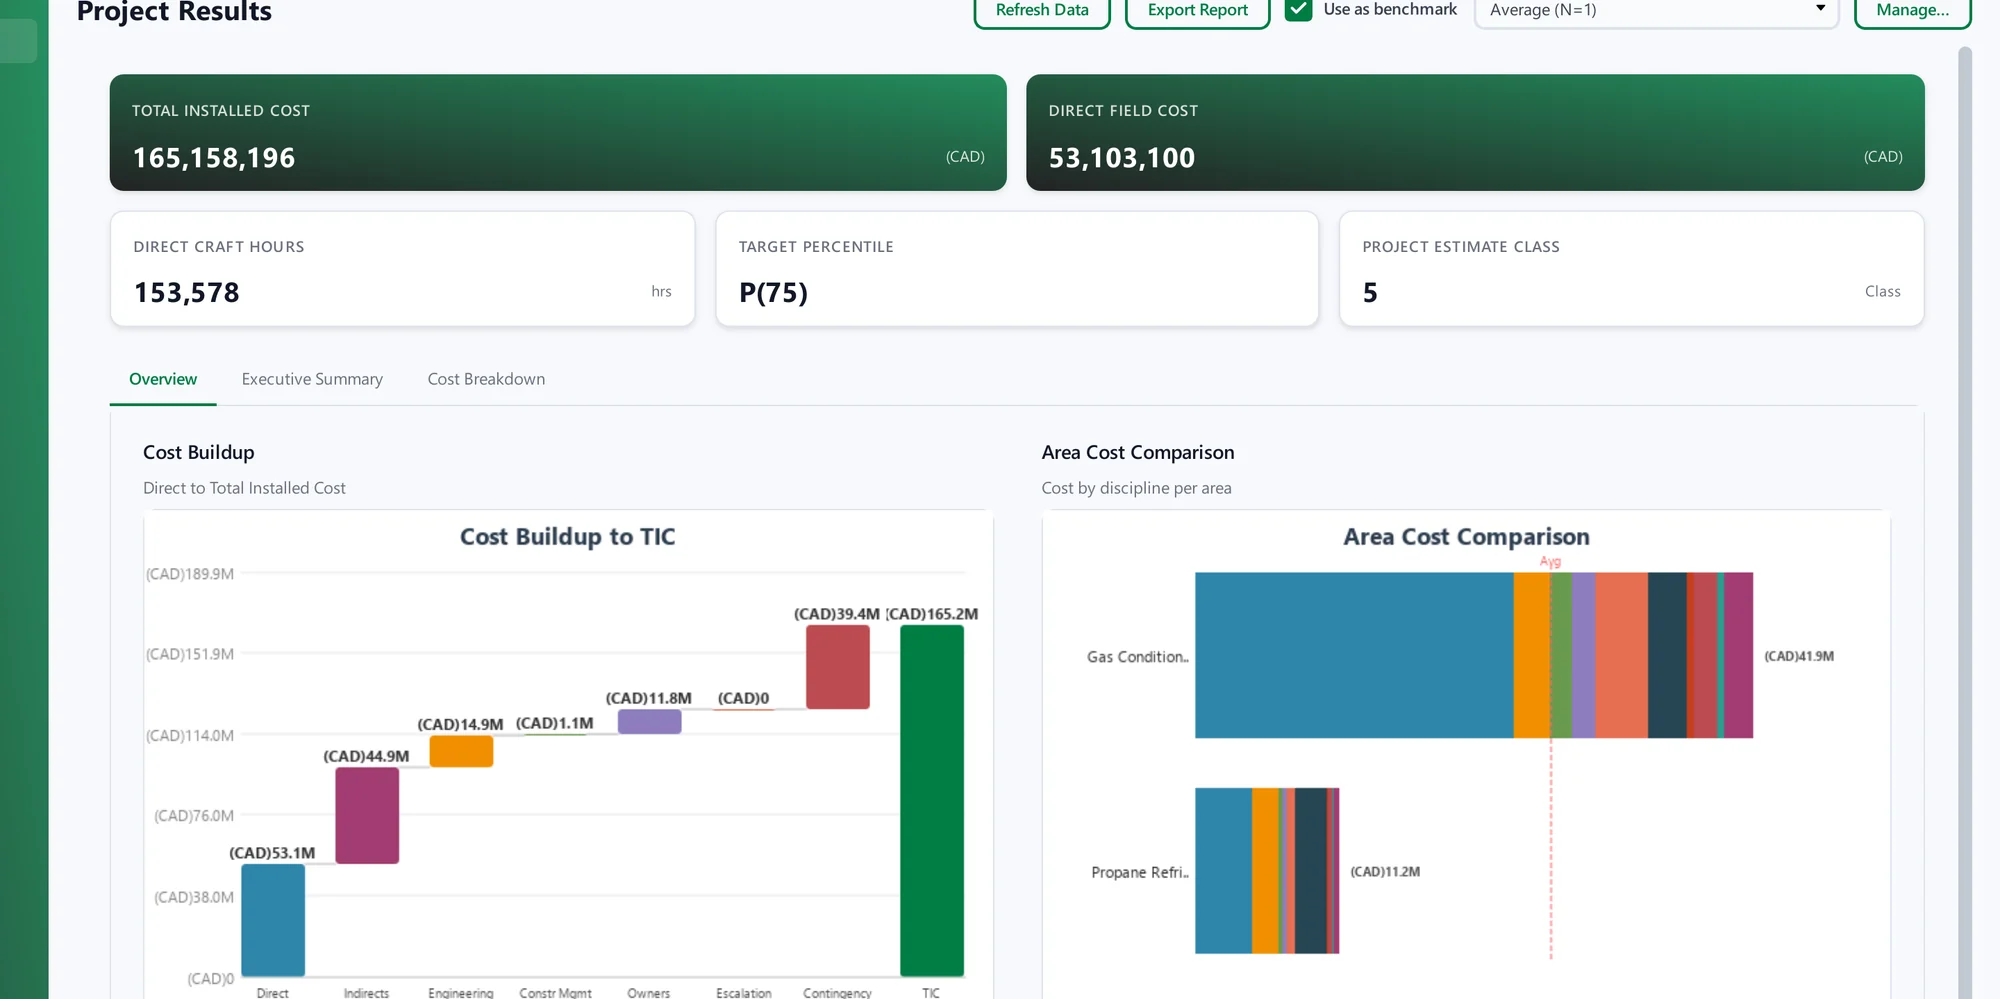
Defend it
Every report draws from the same figures, so your numbers never disagree. You get a full cost breakdown, a risk range, what is driving that risk, and a benchmark against similar projects.
Choose which sheets to include or exclude, with technical detail for a review and a clear, high-level view for management. Add your company logo and it is ready to present.
Try the canvas
Try it: build a simple plant.
Click or drag to place equipment on the canvas, then watch it come to life. Design it, price it, and see what QPlant can do in minutes. This is a simplified demonstration. Speak to us or request a demo to see the full power of QPlant.
Equipment
Start with a separator or a tank.
Live estimate · illustrative
$0
- Equipment
- $0
- Piping
- $0
- Civil and steel
- $0
- Electrical and instruments
- $0
- Indirects
- $0
- Contingency
- $0
Sample values only. Real QPlant estimates use your rates, location and specifications.
See it on your projectFor decision makers
Know the range. Not just the number.
A single figure tells you what a project costs. QPlant tells you how much to trust it, what is shaping that number, and how it stacks up against projects already delivered.
01Know the range
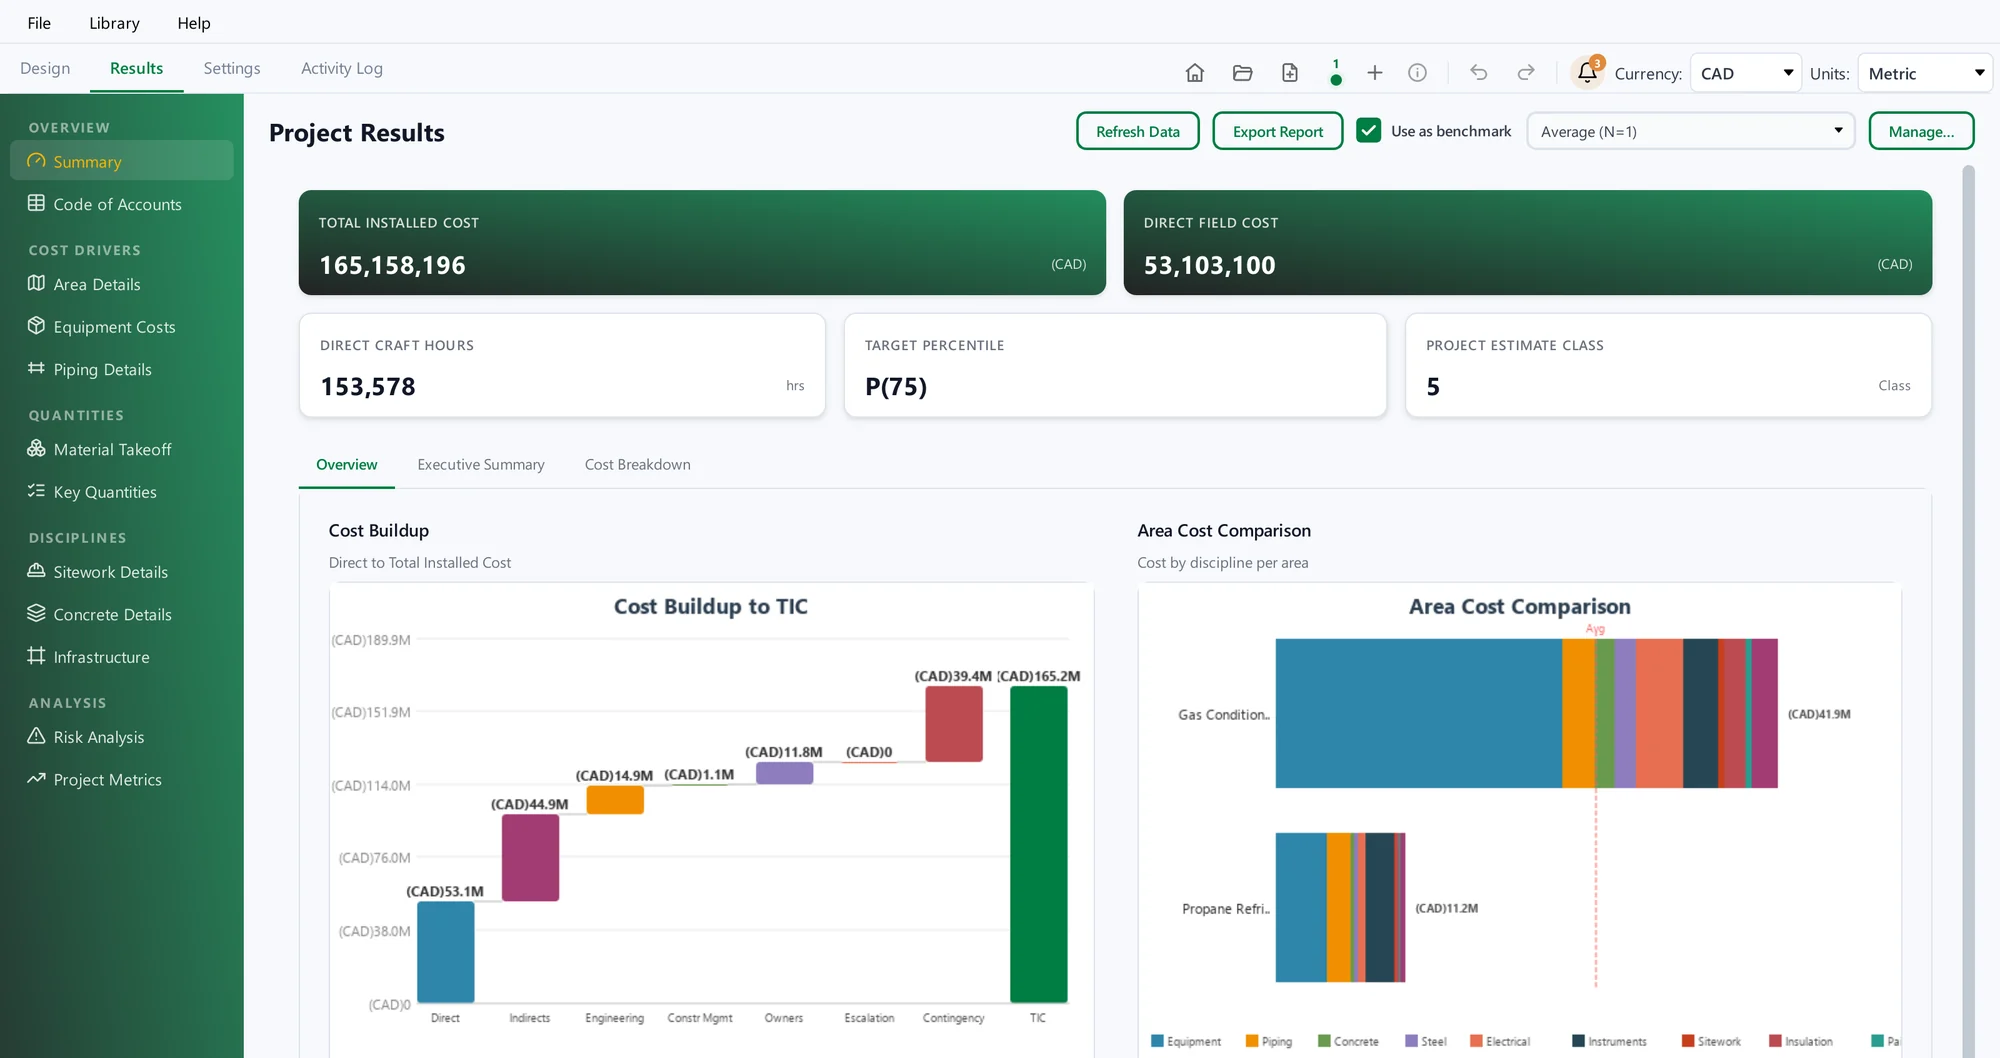
A P10 to P90 range on every figure.
QPlant runs a risk simulation on your estimate and plots P10, P50, and P90 values within the accuracy band that matches how well your project is defined.
Recommended AACE risk ranges are applied automatically to each estimate class, so the range reflects the definition behind it. As the project becomes better defined, the range tightens, and the more you can rely on the figure you present.
02See what drives risk
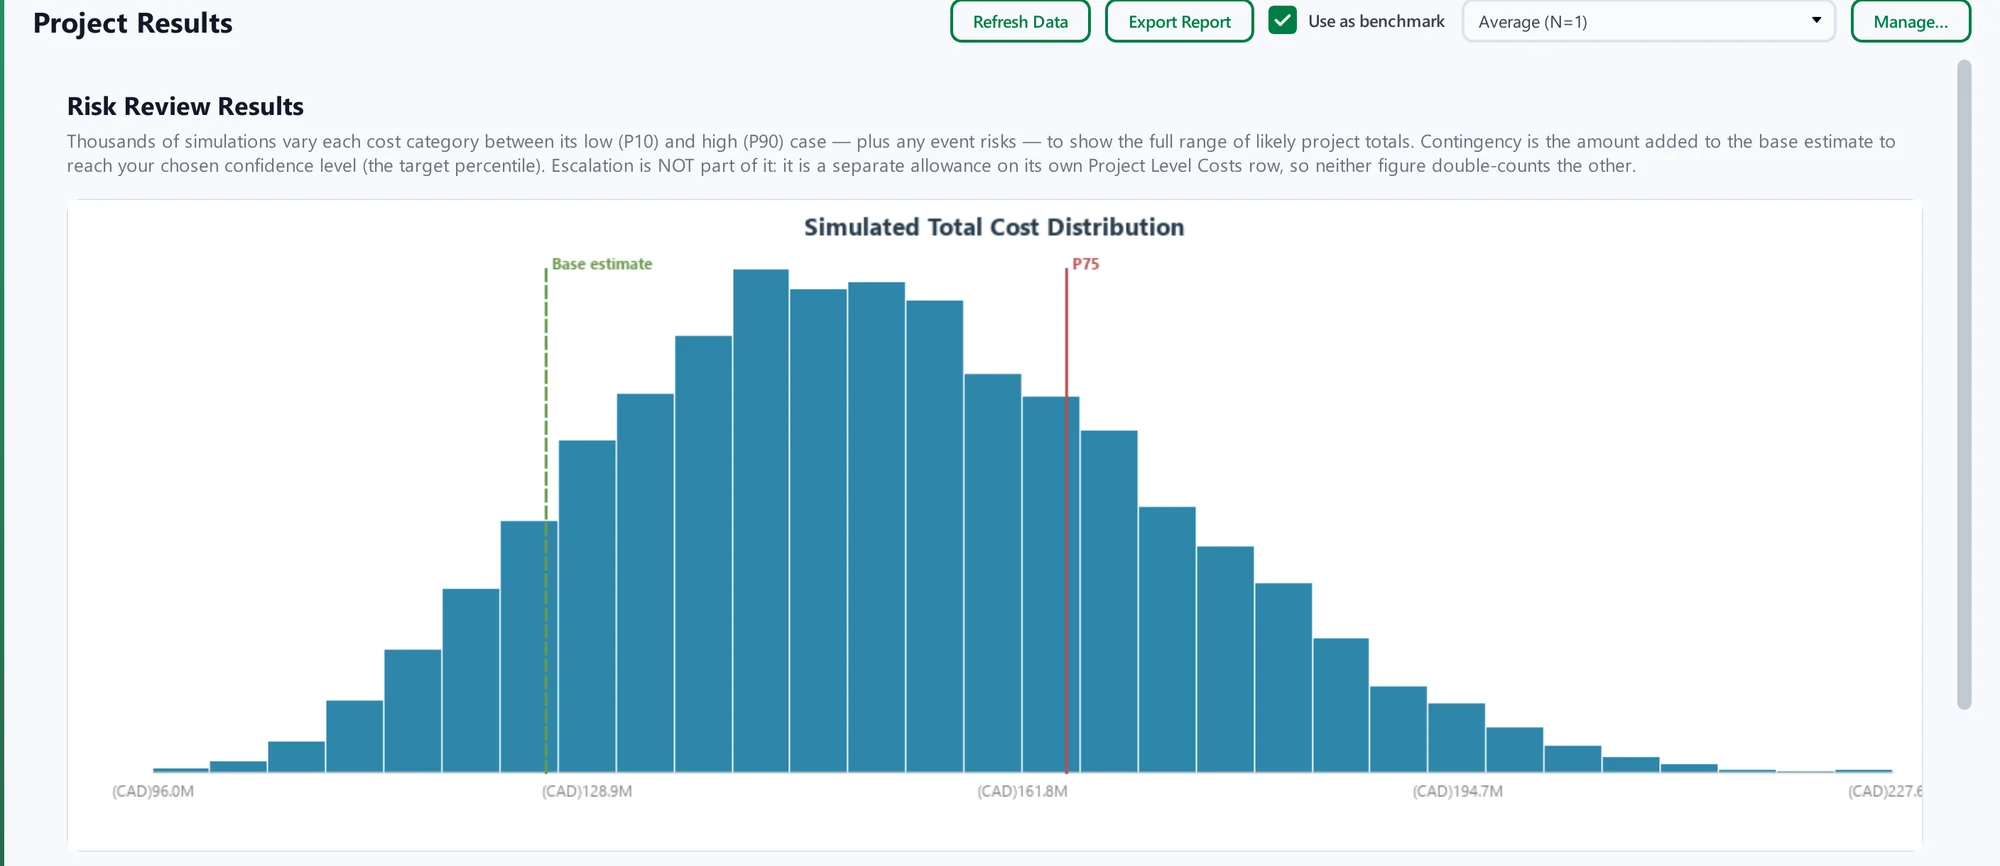
Contingency you can justify.
Enter best and worst cases for each discipline and a target percentile. QPlant simulates the possible outcomes, recommends your contingency, and ranks the items that move your total the most.
Your contingency is built from your own numbers, so you can see where the risk comes from and what to hold for it.
03Benchmark before you commit
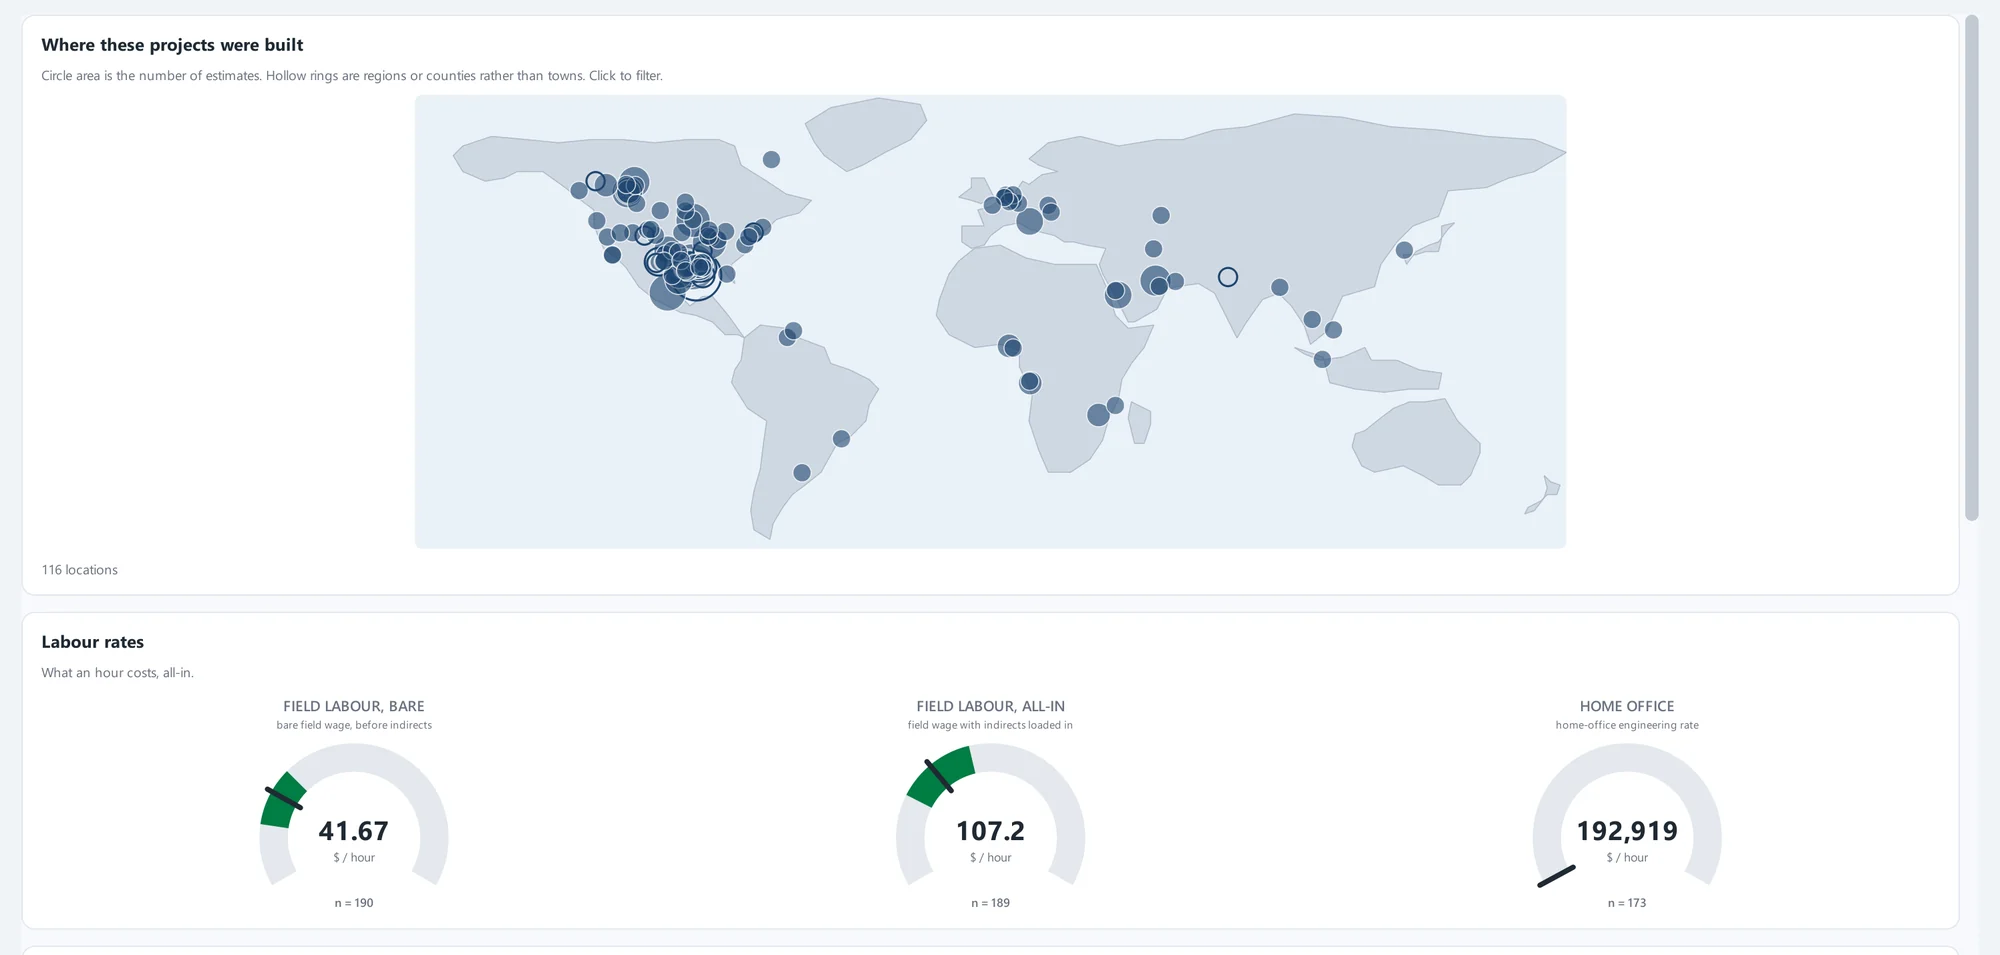
Test your estimate against completed projects.
Compare your project with anonymized, completed industry estimates, as well as your own saved projects.
Fine-tune the comparison to match the market you are competing in. Markers show where you sit relative to what you benchmarked your project to, so you can see how your estimate stacks up before you commit.
04Compare options, keep the record
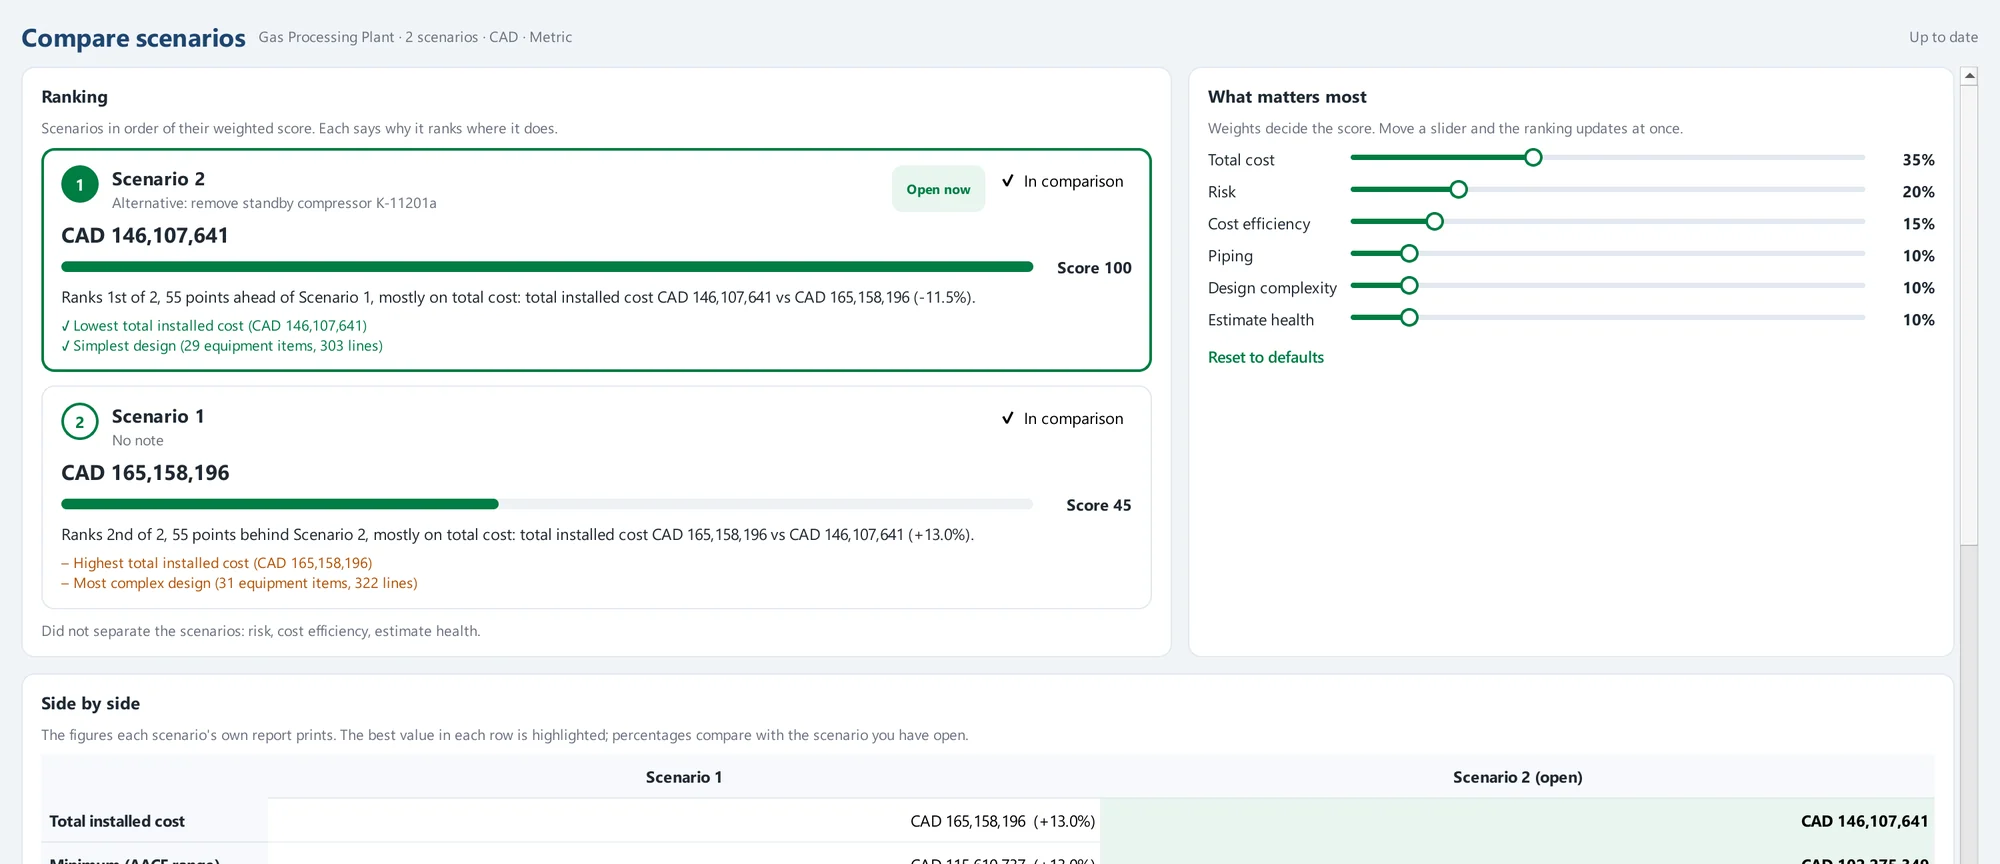
Explore scenarios, lock what matters.
Test what-if scenarios to choose the best estimate. Run scenarios side by side, rank them on cost, risk, piping, and complexity using weights you choose, and see which option comes out ahead.
Lock a scenario and its figures stay exactly as you signed them off.
Who it is for
Built for the people who own the outcome.
Choose your role to see what QPlant offers you.
Cost estimators
Process engineers
Project and business leaders
Estimating that puts you in control and keeps you moving.
- From first concept, you have an estimate. QPlant starts from the information you have, so limited information is no longer a blocker, and you can produce a credible estimate that sharpens as the project develops.
- Less entering, fewer edits, faster changes. Defaults and automatically attached items cut the manual work, and when the project changes, the financials follow automatically, with no reconciliation required.
- Your pricing, your index. Load your cost library and index, and QPlant prices from figures you already trust, with every rate visible, adjustable, and under your control.
- Compare scenarios and report with confidence. Lock a scenario, test the alternatives to see what works best, and benchmark them in minutes.
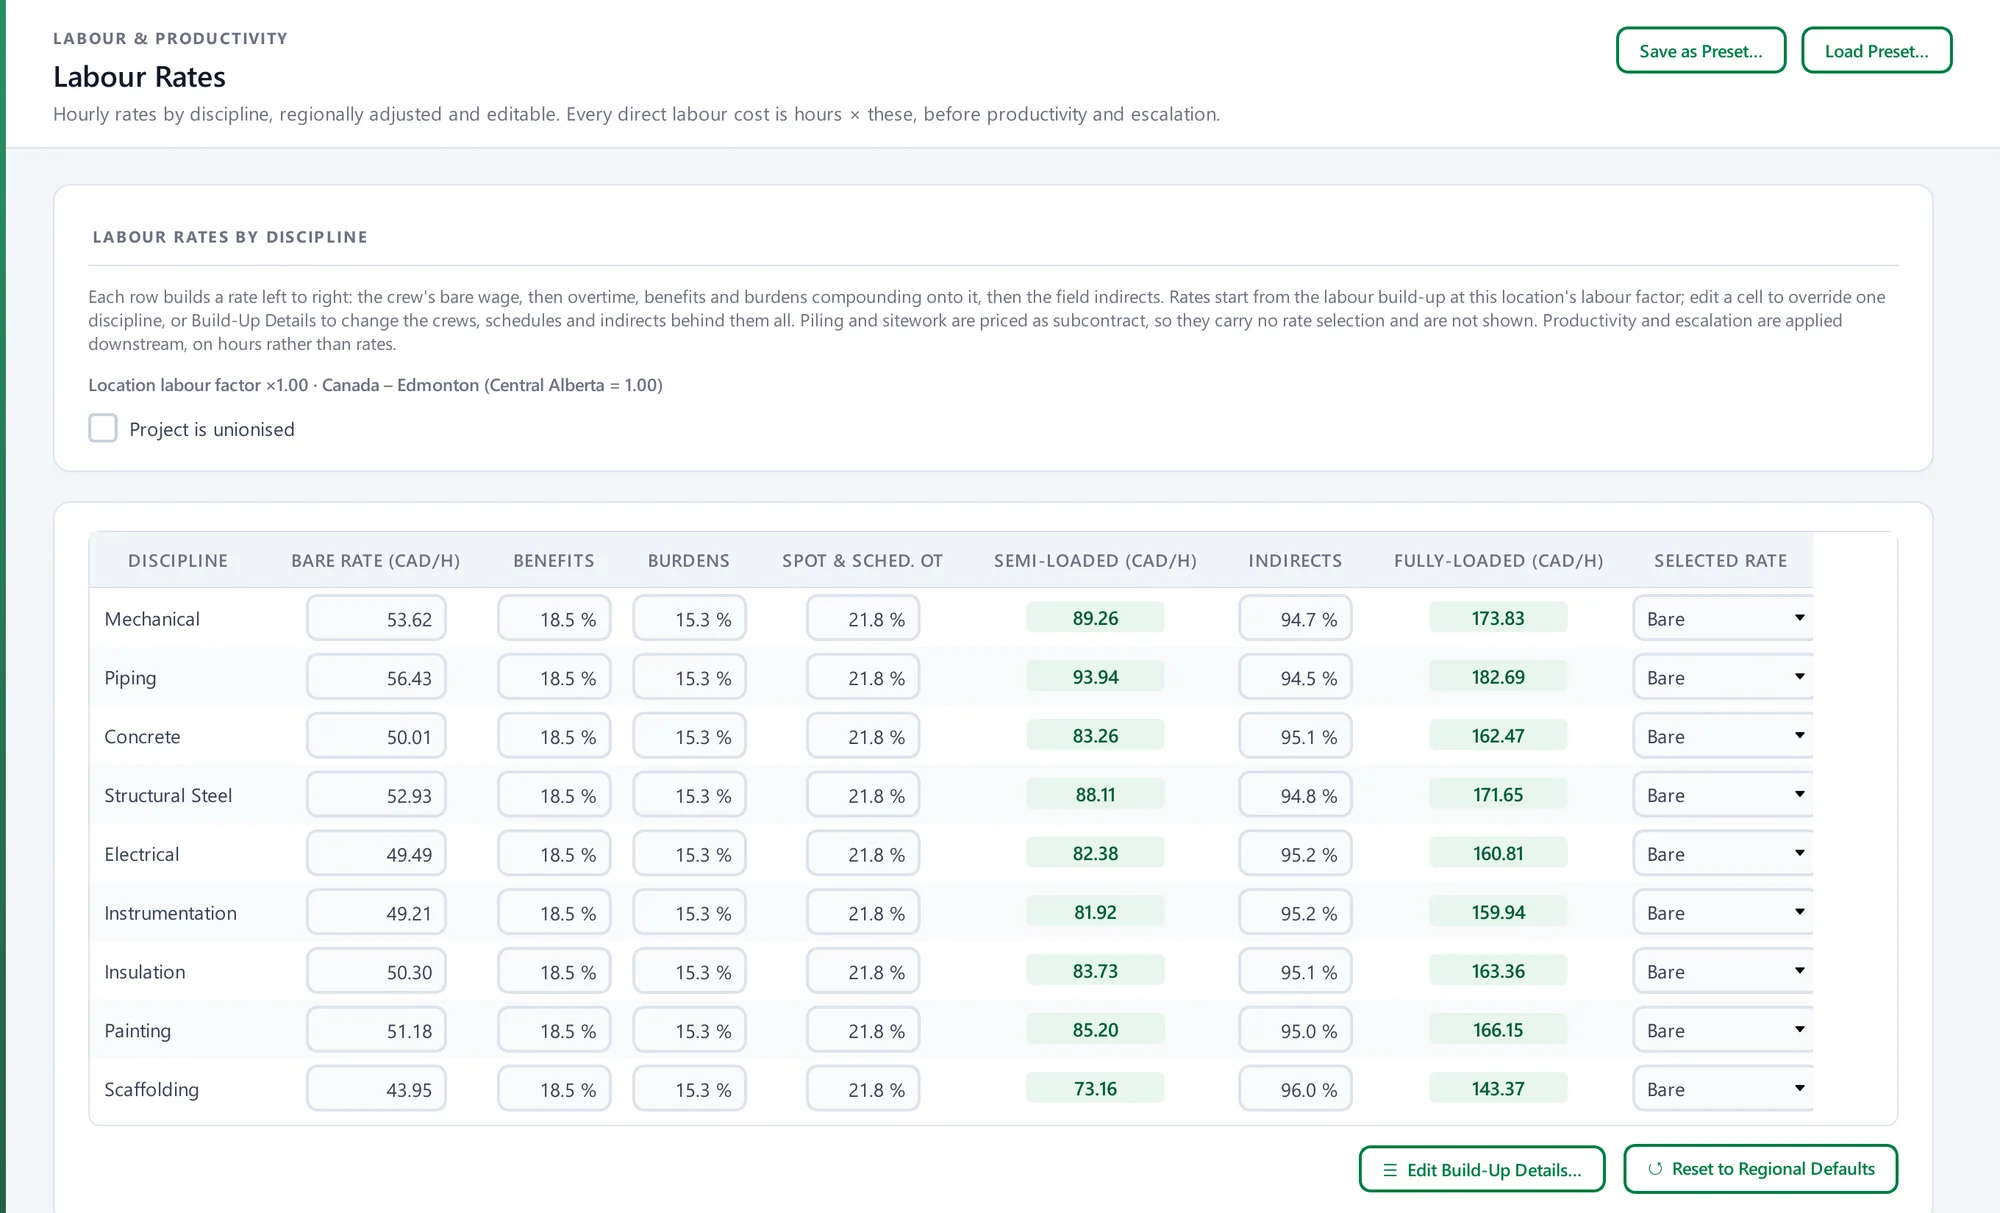
You know the plant. Now know the number.
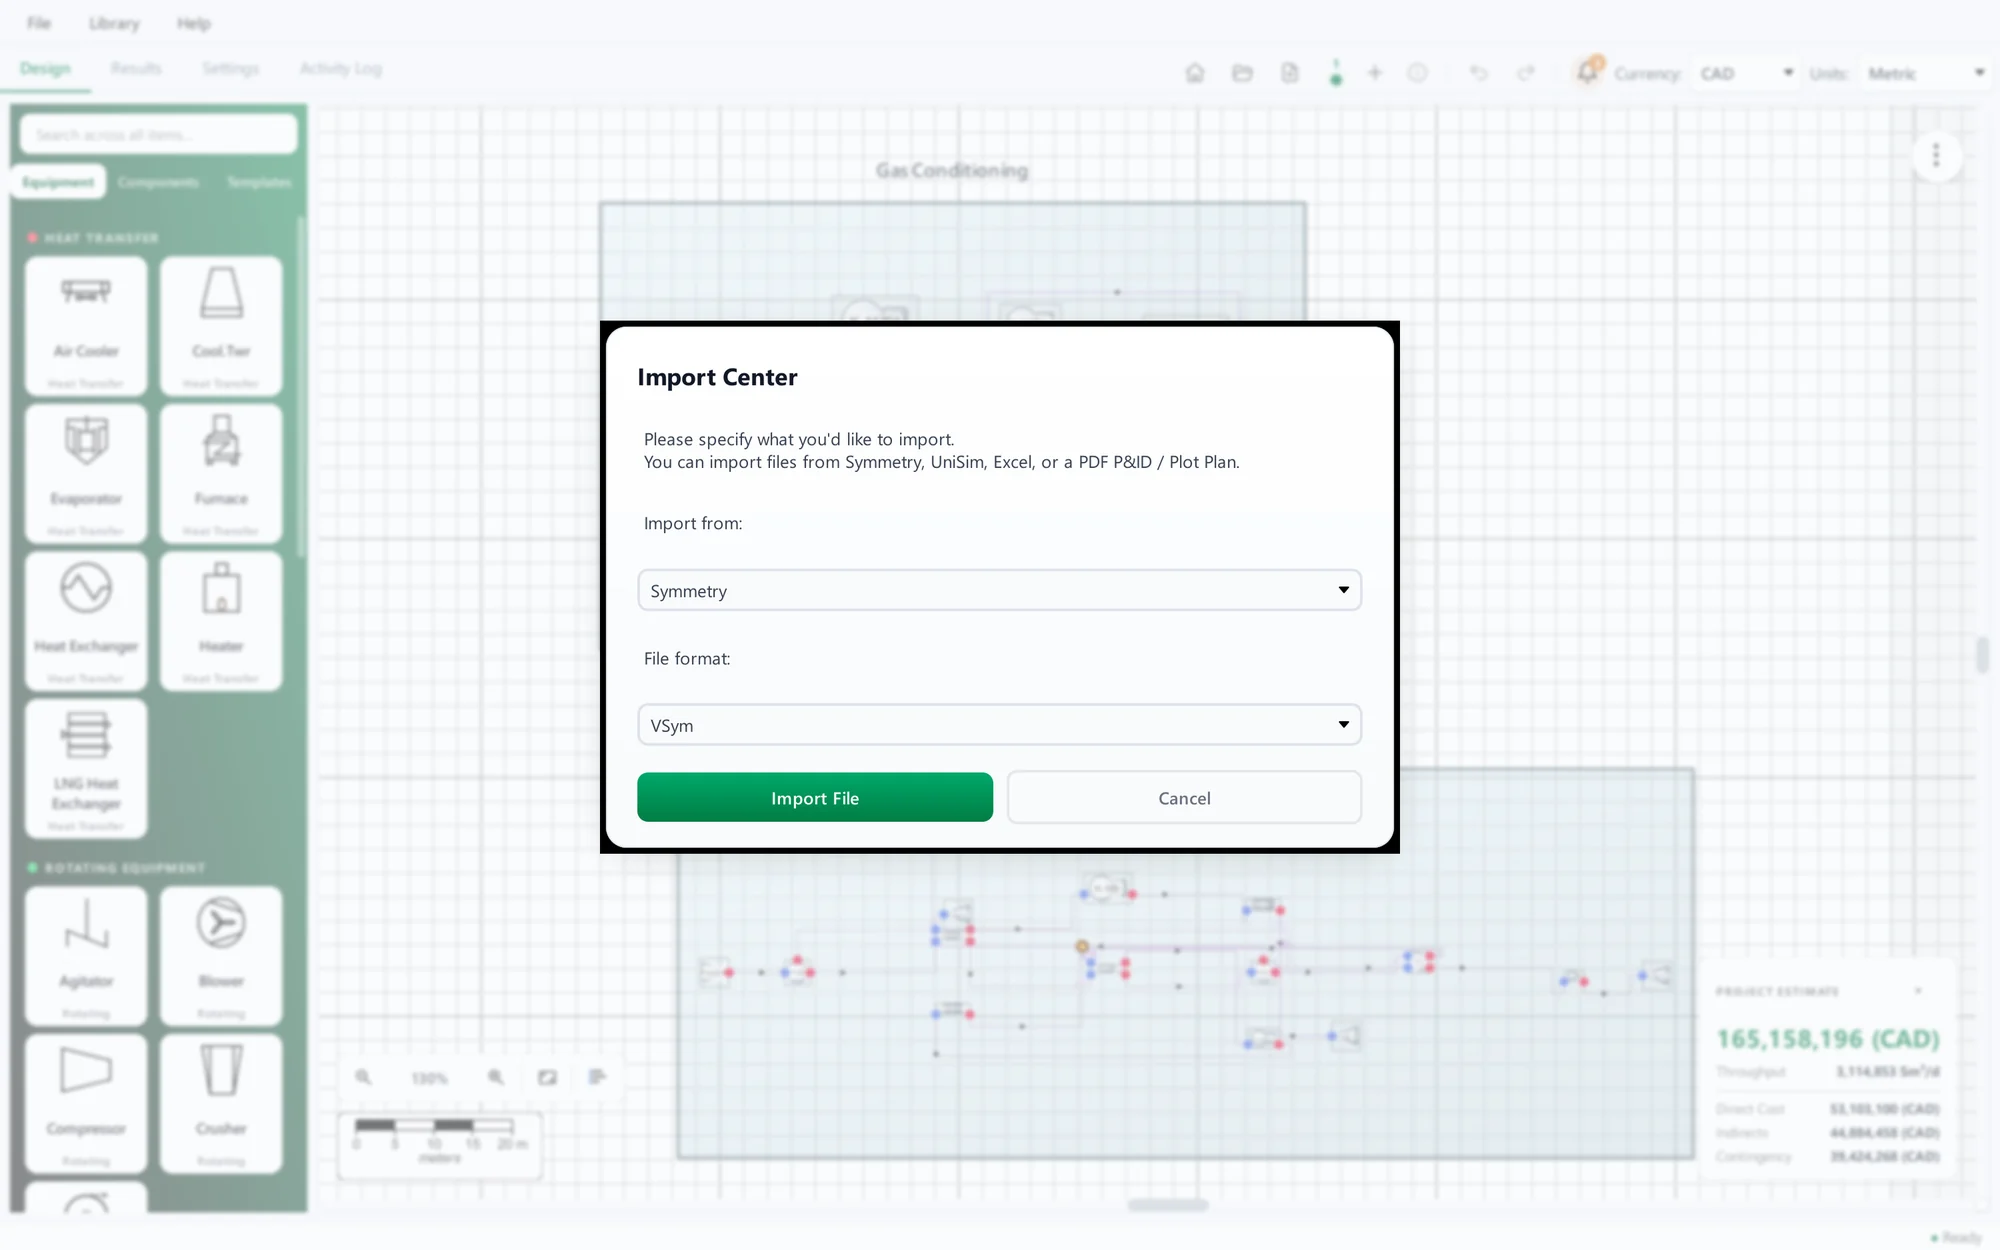
- Bring your project or build it here. Import cases from leading process simulators, along with P&IDs, plot plans, and equipment lists, or arrange it directly on the canvas. From there, QPlant turns it into a live model, so your project data carries straight across, with no manual entry required.
- Cost visibility as you work. Spacing, footprints, racks, and routing determine piping, steel, and civil quantities, so the take-off and the financials both reflect the layout as it stands, updating with every change.
- Resolve issues in FEED, not field. QPlant flags bottlenecks, clashes, and open connections as you work, and lets you test scenarios to see what holds up on site. Issues surface early, so you can refine the layout before detailed engineering.
- Give the instruction. Get the result. QIntelligence is an AI copilot built into the designer. Describe what you want, and it builds or changes the layout for you. It runs locally, so your project data never leaves your device.
See the risk. Own the decision.
- A credible number from the conceptual phase. Get a cost view early, when information is still limited, and watch it sharpen as the project develops, so capital decisions are informed from the outset, not delayed until the detail arrives.
- Confidence in every figure. Each estimate carries a P10 to P90 range alongside the factors most likely to move it, so you can see the spread, understand what is driving it, and commit with a clear view of the risk.
- Business continuity, built in. Your estimating method lives in QPlant rather than in spreadsheets, so it stays consistent through staff changes and across projects. Institutional knowledge stays with the business.
- Accountable, and ready for the boardroom. QPlant produces detailed, audience-specific reports. With assumptions visible and a clear audit trail, each figure can be traced and defended.
- Collaboration. Estimators and process engineers work from the same model, and QPlant’s intuitive interface was built so that estimators of any experience level can pick up an estimate and start working.
A different starting point
Others start with a table. QPlant starts with what you have.
Starting from what you have changes how the estimate behaves. A traditional approach means rebuilding work every time the layout changes. QPlant keeps cost and layout together, so updates carry through on their own, problems surface while they are still easy to fix, and the figures you take forward hold up.
Where you start
A blank grid or last project’s file
The plant itselfDrawn on the canvas, or imported from P&IDs, plot plans and simulator cases.
When you only know the basics
Wait for more detail, or guess
Start with what you haveBuilt-in defaults fill the gaps, and the estimate sharpens as the design develops.
When the design changes
Edit cells, chase links, re-check totals
Costs follow the layoutMove equipment and the pipes, quantities and totals update.
Piping
Quantities typed in by hand
Routed, sized and pricedOr import your own MTO and price that.
Catching mistakes
Found during review, if at all
Flagged as you designCollisions, rack capacity and open connections.
Risk
A contingency percentage
A simulated rangeP10, P50 and P90, plus the drivers behind them.
Audit trail
Separate file versions
Scenarios you can lockReports show the same figures as the screen.
A general comparison of approaches. Individual products vary.
Stop maintaining a spreadsheet. Start from the plant.
Make it yours
Support from the people who build QPlant.
Training, set-up, and estimating support come directly from the QPlant team. Whether you need expert consultancy on a complicated estimate, or your team trained to get the most from QPlant, talk to us and we’ll show you how to get there.

Consultancy
Expert guidance, when it matters.
We can configure QPlant to your standards or bring in an experienced estimating team to work alongside yours, giving you expertise that fits how you already work and support that scales to the demands of your project.
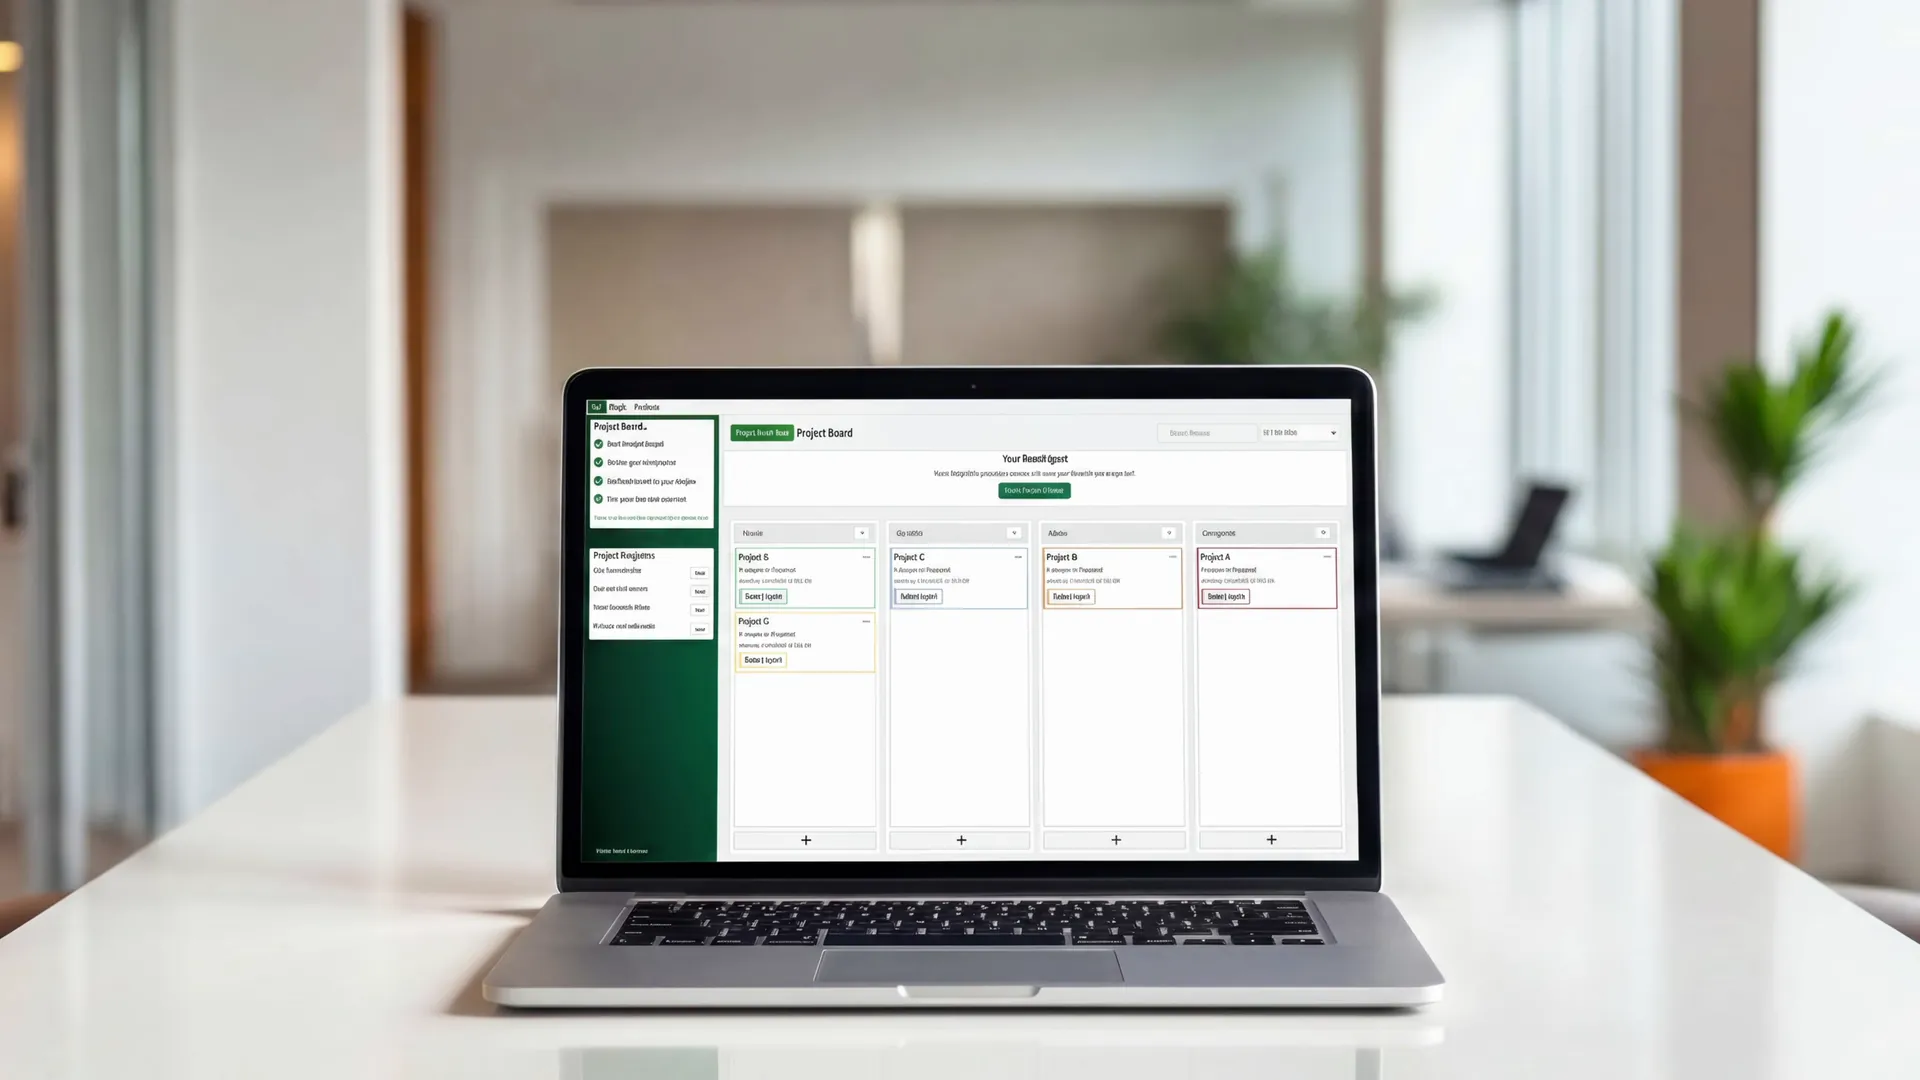
Training & Implementation
Training that lasts, support that scales.
Learn at your own pace or book private training to get your team confident in QPlant, with hands-on support to integrate it into your workflow.

A demo shaped around you
Tell us what matters. We will show you how QPlant fits.
Tell us what you need and what you would like to see, and we will set up a live demo, online or in person.
Tell us your needs.
What you are deciding and what matters most to you.
See it live.
We focus the demo on what you told us you want to see.
Get your team started.
Talk to us about private training for your team.